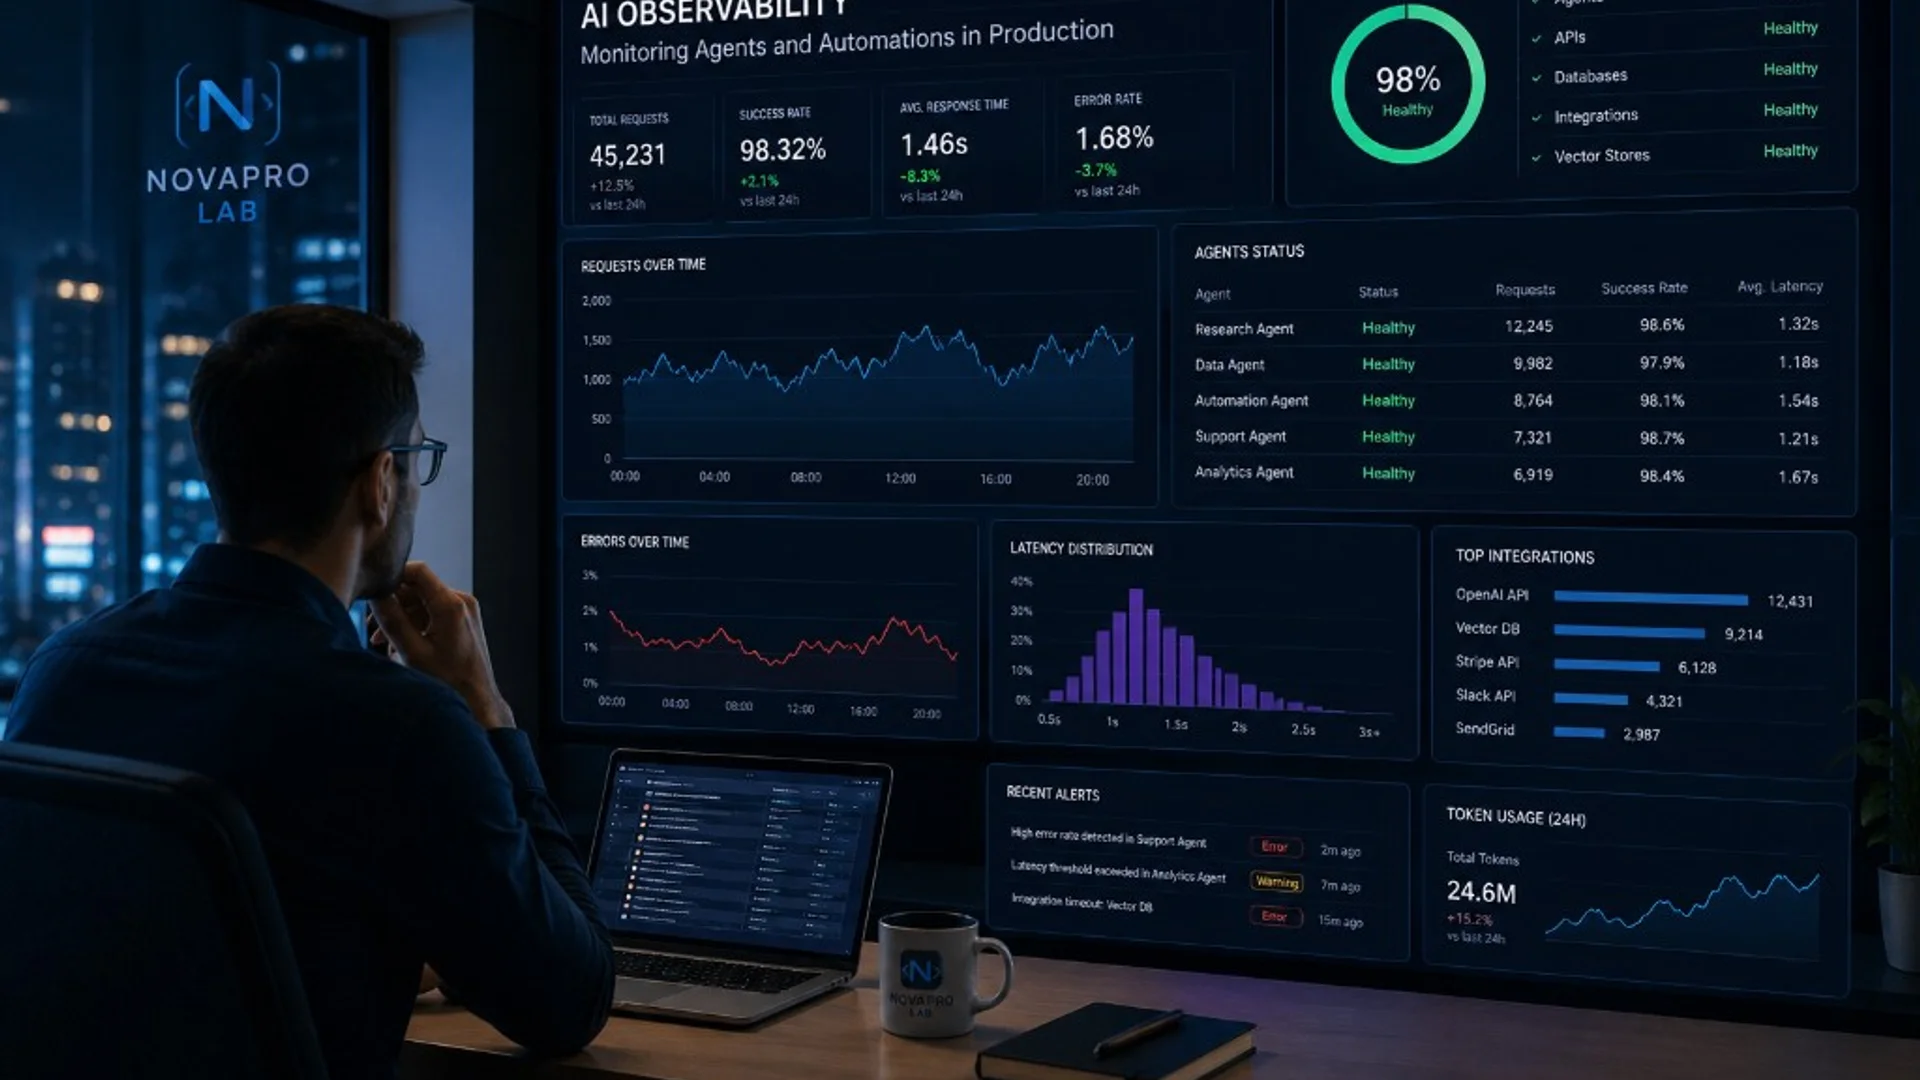
What is AI observability? AI observability is the set of practices and tooling that lets teams see how AI agents, LLM calls, retrieval steps, tools, and automated workflows behave in production— including cost, latency, failures, decision traces, and human approval outcomes.
Companies are moving from AI experiments to AI agents in business operations. That shift creates a new operational layer: models that reason, call APIs, branch across steps, and sometimes act on live data. AI observability (also called LLM observability or AI agent monitoring) is how you keep that layer understandable, affordable, and accountable without pretending risk disappears.
Introduction
Operations leaders, founders, and technology managers often discover the same gap after launch: demos were fluent, but production behavior is harder to explain. A support agent retries the wrong tool. Token spend spikes on a quiet weekend. A workflow completes but no one can reconstruct why a customer record changed.
Observability does not replace AI governance or human judgment. It supplies the signals governance depends on—who approved what, which model ran, what failed, and what it cost—so teams can respond with evidence instead of assumptions.
What AI observability means
In conventional software, observability usually means metrics, logs, and distributed traces for services and databases. AI system monitoring extends that idea to non-deterministic components:
- Model and agent activity — which agent or workflow ran, with what inputs and outcomes
- Prompt and response traces — structured records of prompts, retrieved context, and model outputs (with redaction for sensitive fields)
- Tool calls — which APIs or functions were invoked, with parameters, status codes, and latency
- Workflow execution — step order, branch decisions, queue times, and idempotency keys
What should a business monitor in an AI system? At minimum: activity volume, success and error rates, cost per workflow, latency percentiles, approval queue depth, audit completeness, and integration health. Tie those signals to business KPIs—tickets resolved, leads qualified, reports generated—not only infrastructure charts.
Why traditional software monitoring is not enough
Application performance monitoring (APM) still matters for hosts, containers, and APIs. But AI workflows add failure modes APM was not designed to interpret:
- Hallucination risk — fluent text that is wrong or unsupported by retrieved context
- Tool misuse — valid HTTP 200 responses that update the wrong record
- Prompt drift — silent behavior changes when prompts, models, or retrieval indexes change
- Cost spikes — long context windows, retry loops, or runaway agent planning
Traditional dashboards may show green infrastructure while business outcomes degrade. AI workflow monitoring connects technical traces to workflow identifiers, customer IDs (where policy allows), and approval states so operators see business impact—not only CPU usage.
What businesses should monitor
Use this monitoring checklist as a starting point for AI monitoring for business teams:
| Area | Examples |
|---|---|
| Activity | Runs per hour, active agents, concurrent workflows |
| Quality signals | Human overrides, low-confidence flags, retrieval misses |
| Cost | Tokens per run, model tier usage, embedding and vector costs |
| Latency | End-to-end workflow time, model time, tool time |
| Reliability | Failed runs, retry counts, fallback model usage |
| Governance | Approval wait time, rejected actions, policy blocks |
| Security | Access denials, sensitive field redaction events |
Assign operational ownership: engineering instruments traces; operations defines thresholds; security validates audit and access controls.
Decision traces and agent behavior
Decision traces (sometimes called run traces or spans) document how an agent moved from trigger to outcome. A useful trace includes:
- Correlation ID shared across services
- Input snapshot or hash (not always raw PII)
- Retrieval queries and source document IDs
- Model version and parameters
- Tool call sequence with outcomes
- Policy evaluations and human approval records
Traces support debugging, customer support, and post-incident review. They also help teams compare agent behavior before and after prompt or model changes—critical when evaluating agentic vs single-agent designs.
Example: support triage agent
A triage agent might classify tickets, fetch account context, and draft a reply. Observability should show classification confidence, which knowledge articles were retrieved, and whether a human approved before send—not only that the workflow “succeeded.”
Cost and token monitoring
AI cost monitoring is FinOps for models. Track:
- Token consumption by workflow, tenant, team, or customer segment
- Model routing — when cheaper models handle drafts and premium models handle complex steps
- Infrastructure costs — vector databases, embedding jobs, GPU endpoints, third-party API fees
Set budgets and alerts on weekly spend, cost per successful outcome, and anomalies (for example, 3× baseline tokens per run). Cost visibility helps leaders decide when to optimize prompts, cache retrieval, or narrow tool scopes—without blocking useful automation.
Latency and reliability
Response latency affects user experience and operational throughput. Monitor:
- Percentiles (p50, p95, p99) for full workflows and for model-only segments
- Queue time before human approval
- Cold-start effects on serverless or autoscaling inference
Reliability metrics should include success rate by workflow version, error taxonomy (model timeout, tool 4xx/5xx, policy block), and saturation signals (rate limits, concurrency caps).
Dashboards should be readable for non-engineers: operations directors need to see whether SLAs for internal or customer-facing automations are met.
Failures, retries, and fallback behavior
Production AI agents fail in predictable ways: model timeouts, malformed tool arguments, rate limits, or upstream SaaS outages. Define:
- Retry policy — which errors retry, with backoff and max attempts
- Fallback models — smaller or alternate providers when primary inference fails
- Degraded modes — queue for human review instead of silent failure
Log every retry and fallback with reason codes. Without that, teams misread a “successful” run that used a weaker model or skipped a validation step.
Observability improves recovery; it does not guarantee accuracy or remove hallucination risk. Human review and source grounding remain necessary for high-stakes outputs.
Human approval checkpoints
Human-in-the-loop AI is both a control and an observability signal. Monitor:
- Time waiting in approval queues
- Approval vs rejection rates by workflow
- Who approved high-impact actions (identity and timestamp)
Connect approvals to governance rules: external messages, financial updates, bulk exports, and low-confidence classifications should emit explicit events when paused or released.
Privacy, security, and auditability
AI audit trails must balance detail with sensitive-data handling:
- Redact or tokenize PII in stored prompts and responses where full text is not required
- Enforce access controls on trace viewers (role-based, environment-separated)
- Retain logs according to policy—not indefinitely by default
Security monitoring should include failed authentication to agent endpoints, unusual tool call patterns, and attempts to access unauthorized datasets. Observability supports compliance reviews; it does not by itself ensure perfect compliance.
A practical implementation framework
Use this phased framework for enterprise AI operations without unnecessary complexity:
Phase 1 — Instrument one workflow
- Assign a run correlation ID at trigger
- Log start, end, status, model ID, and cost estimate
- Capture tool calls with latency and HTTP status
Phase 2 — Add business context
- Tag runs with workflow name, environment, and owning team
- Link to business KPIs (cases closed, orders validated)
- Define on-call alerts for error rate and cost anomalies
Phase 3 — Governance integration
- Record approval decisions and policy blocks in the same trace
- Build dashboards for operations and leadership review
- Document runbooks for common failure classes
Phase 4 — Continuous improvement
- Compare traces across releases
- Review weekly with product and operations stakeholders
- Align with integration maturity and production platform practices
Common mistakes
Logging only success/failure bits — Without tool and retrieval detail, root cause analysis stalls.
Ignoring cost until finance asks — Token spend is variable; track it from day one.
Storing full prompts with no retention policy — Creates privacy debt and noisy archives.
No owner for dashboards — Unused metrics do not improve operations.
Treating observability as a substitute for governance — Visibility helps; rules and approvals still define what may run automatically.
Skipping test environments — Behavior differs across models and data; compare traces before promoting changes.
Final business recommendations
Treat AI observability as part of production architecture, not a post-launch accessory. Start narrow, measure cost and latency per run, wire human approvals into traces, and review failures with the same discipline as any customer-facing service.
For teams automating cross-system work, observability pairs naturally with clear process design—see business processes ready for automation—and with integration health across APIs and data sources.
Novapro Lab helps businesses design and build production software, AI agents, automation, and integrations with operational controls—logging, approvals, and deployment patterns suited to real environments, without overpromising what AI can guarantee.
Ready to discuss observability for your workflows? Schedule a consultation with Novapro Lab to review agents, costs, and production requirements.
FAQ
What is AI observability?
AI observability is the practice of collecting traces, metrics, and logs from AI agents, LLM calls, tools, and workflows so teams can understand behavior, cost, latency, failures, and human approval outcomes in production.
What should a business monitor in an AI system?
Monitor agent activity, prompts and responses (with redaction), tool calls, workflow steps, token and infrastructure cost, latency, failed runs, retries, fallback models, approval checkpoints, audit trails, access controls, alerts, and KPIs tied to business outcomes.
How is AI observability different from traditional monitoring?
Traditional monitoring focuses on services and infrastructure health. AI observability adds model outputs, retrieval, tool chains, non-deterministic failures, and governance events—and links them to business workflows.
Does AI observability remove hallucination risk?
No. It helps teams detect patterns, investigate incidents, and improve prompts and retrieval. Validation, grounding, and human review remain essential for high-stakes decisions.
What is a decision trace?
A decision trace is a structured record of how an automated AI workflow progressed—from trigger through retrieval, model calls, tool use, policy checks, and approvals—to final outcome.
Who should operate AI observability day to day?
Engineering typically owns instrumentation; operations or product owns KPIs and thresholds; security or compliance owns audit retention and access policies—with shared review cadences.